The new Mountains® 10.2 version release is just around the corner, with a preview scheduled at the Control trade show for quality assurance in Stuttgart to be held next April 23-26. The Digital Surf team is excited to showcase a number of new features, in particular dedicated to users working with topographic data. In the context of smarter manufacturing, many new tools contained in this version will contribute to improving automated practices in production environments. Read on to find out more.
Point cloud stitching
In industrial metrology or inspection, point clouds offer a way to accurately create digital representation of surfaces, for example to check a manufactured part against an existing model.
Version 10.2 builds on previous releases to add a new Assemble Point Cloud feature. Multiple point clouds, measured from different angles can now be stitched into a single point cloud. Overlaps are automatically detected and managed by the software. Stitched point clouds can then be converted to Shells (freeform surfaces) for metrological analysis.
New power spectral density tool
Power spectral density (PSD) provides a representation of the amplitude of a surface’s roughness as a function of its spatial frequency. It is used notably in optics and multi-scale analysis.
In Mountains® 10.2, in addition to the Average spectrum tool previously available, users now have access to a new Power Spectral Density feature. This allows log-log graph display with line fitting on the linear part, in order to calculate A and B parameters, according to ISO 10110-8.
Critical dimension metrology
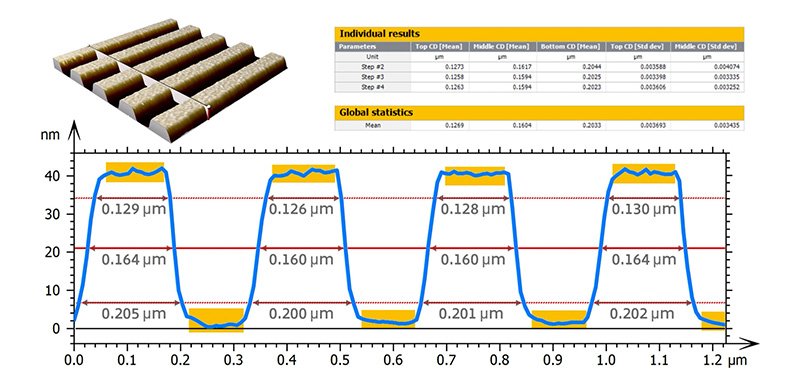
Another exciting addition to Mountains® analysis software comes in the form of the new Critical Dimensions & Trenches optional module.
Customers analyzing critical dimensions in semiconductor fabrication processes with atomic force microscopy (AFM), scanning electron microscopy (SEM) or optical profilometry can now:
- Detect peaks or trenches quickly and easily
- Calculate parameters relative to critical dimension analysis: height, top/middle/bottom CD, sidewall angle, pitch, width/pitch ratio etc.
- Display surface geometry and values for each profile or for each pattern
- Statistically evaluate each detected pattern.
On SEM image data, users can calculate line edge roughness (LER) and line width roughness (LWR) parameters on the edges of detected bands, including in automated processes.

Above. New Critical Dimensions study for analysis of semiconductor fabrication processes.
New options & improved 3D rendering of cubes
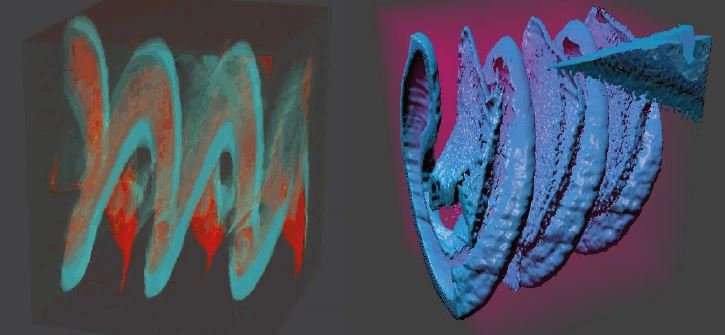
Voxel cubes of mono-channel and multi-channel data acquired using various techniques (FIB-SEM, confocal Raman etc.) have had a make-over in new version 10.2. Users can now:
- Extract shells from voxel cubes: extract a Shell (freeform surface), detected at a particular density threshold, from a voxel cube measured by X-ray computed tomography (XCT)
- Improvements for volume electron microscopy: extract a sub-area when loading image stacks, segment data according to intensity and benefit from improved 3D rendering of cubes.
- Improved 3D rendering of multi-channel EDS cubes (mixed, combined, dominant).

Above. Improved 3D rendering of cubes: volumetric (left) and iso surface (right).
Many other helpful improvements
- More options in template mode
- More control over parameter configuration
- Improvements to Contour study
- Better Particle Analysis
- Better W-axis (spectral axis) management
- Peak fitting: new settings
- Enhanced nanoindentation analysis
Learn more & update
Check wwww.digitalsurf.com for full details of the V10.2 release (available May 2024).
Access to the new version is included for users with an active Mountains® Software Maintenance Plan. To find out more about your Maintenance options, please contact sales@digitalsurf.com