The Contour Analysis study in Mountains® allows users to calculate and show distances, angles, radii etc. on a measured profile and check for deviations. This tool is particularly useful in quality control, for studying the form of an object or for comparing shapes to CAD drawings and is essentially applied to profiles measured on mechanical parts. Following the recent broadcast of a webinar on this topic, here’s a quick introduction in the form of 5 useful tips.
1. Two dedicated toolbars for easy access
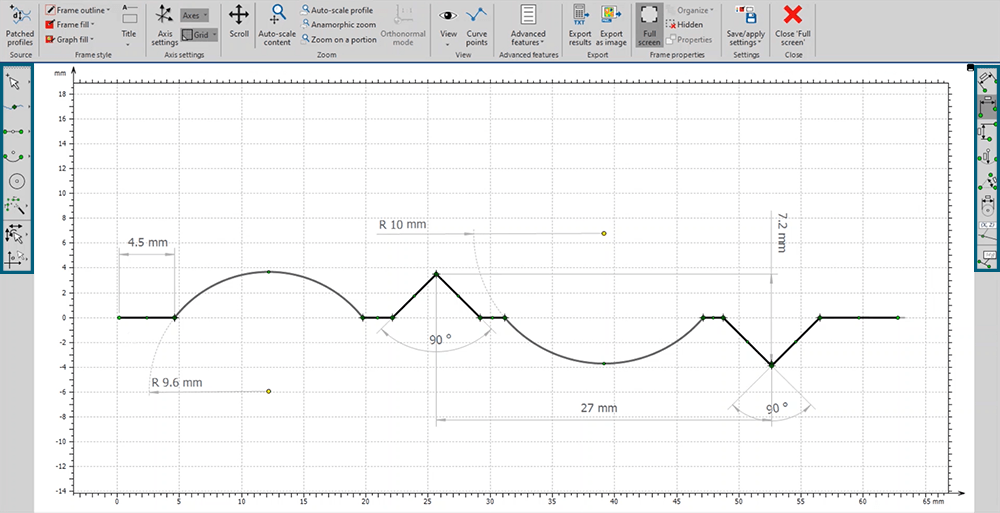
When conducting a Contour Analysis study with Mountains®, two dedicated toolbars will appear on each side of your study. These panels provide easy access to the different tools available. On the left-hand side, you will find tools for creating and manipulating different elements. On the right hand-side one you will find all of the calculation tools available for this type of analysis.

Above. Contour Analysis of a horizontal profile studiable in Mountains®. Tools for creating and manipulating elements are to be found on the toolbar to the left, while tools for calculation are on the right.
2. Creating points, segments, arcs and more
Creating matching elements, such as points, segments, arcs and circles on measured contours is pretty simple. Just head over to the left-hand toolbar to find the multitude of options available.
Numerous automatic detection features are implemented in Mountains® in order to make analysis more efficient and easier to conduct. For instance, with the Create Lowest Point tool, you can simply click on your profile and Mountains® will find the lowest point for you and create it. With the Auto-Connect tool you can join multiple segments of your profile in just one click.
3. Calculating distances angles and values
Calculating horizontal, vertical or oblique distances on different elements is also possible in Mountains®, this can be done with the measuring tools located in the toolbar on the right. This toolbar is also home to tools for measuring angles, diameters and radii.
4. Generating planar contours from surfaces
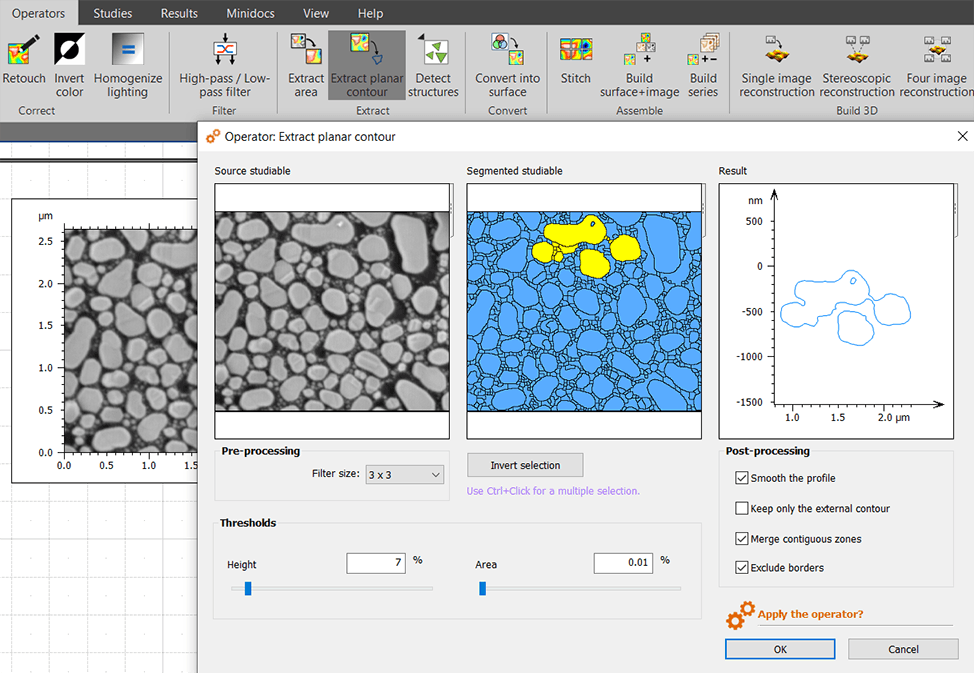
With the Extract Planar Contour Operator, it is possible to apply Contour Analysis to the shape of a surface. Mountains® uses Watershed segmentation to identify and extract this shape. Local height and area thresholds are adjustable, which gives users full control over how contours are detected. Once you are satisfied with your settings, the software will generate a contour profile ready to be analyzed.
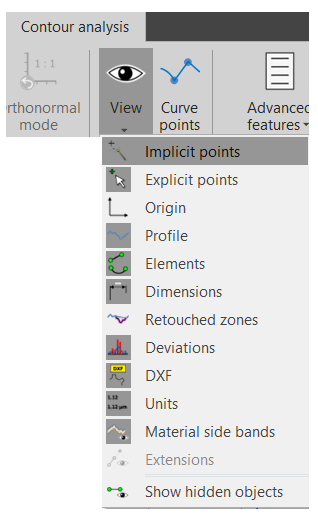
| Did you know implicit points are created automatically by Mountains®? To display them go to the View icon, located in the ribbon, then click on Implicit Points. The coordinates of your elements will appear when you hover over them with the cursor. You can also display coordinates by using the Add Point Coordinates tool, located on the right-hand toolbar.  |
5. Displaying pass/fail tests
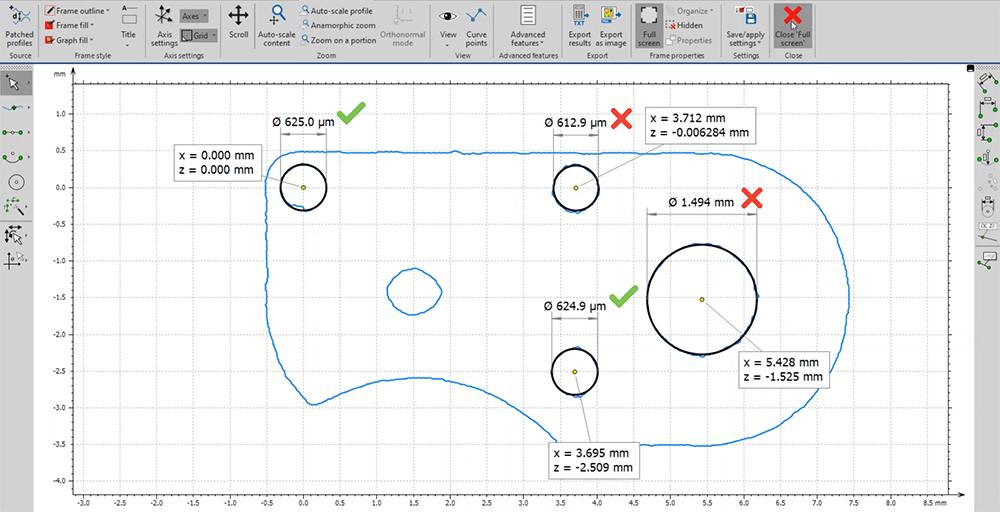
In Mountains® it is possible to display pass/fail tests directly in the Contour Analysis study. You can do so by clicking on your reference value, then on Define Tolerance Limits situated in the ribbon. A Tolerance limits management window will open up with the values available in your study. Select those you wish to track, then click on Track Limits of Result and set a limit for each.

Above. A planar contour extracted from a surface studiable of a mechanical piece with pass/fail tests.
Contour Analysis for SEM images
The Contour Analysis study can also be applied to SEM images. To do so, simply load your image into Mountains®, select the Extract Planar Contour option and click on the segments you wish to study.

Learn more
All tools shown are available in the Mountains® Contour Analysis module: digitalsurf.com/optional-modules/contour
Watch our webinar on Contour Analysis with Mountains®: www.gotostage.com/channel/digital-surf