The Fast Fourier Transform (FFT) is used in many fields of science and engineering and allows visualization of the frequencies (wavelengths) of a signal. In Mountains®, analysis tools based on FFT can help users determine the periodicity and orientation of certain motifs, in addition to roughness, by showing the frequencies found in the spectrum. Anne Berger, direct sales manager, explains.
For anyone wishing to perform advanced analysis of the topography of a surface, whether their data be obtained using 3D profilometry or atomic force microscopy (or other types of scanning probe microscopy), FFT-based tools can be particularly effective.
They can be used for instance to make a bandwidth filtering by removing the form, the waviness and the microroughness at the same time in order to keep only the roughness. Filtering using the FFT can also be employed to separate motifs of different directions (e.g. honing grooves on a motor cylinder).
First step: make sure you’re working with surface data
Mountains® software is designed to be as easy-to-use as possible and so you will need to remember that available tools will only be shown in the contextual ribbon if an appropriate type of data is selected in the document. If you are not seeing the tools presented in this article, please first make sure that you have selected a surface (i.e. measurement of heights over a rectangular area).
In particular, please note that if you are working with multi-channel data (for example coming from scanning probe microscopy), you will first need to extract the channel (or layer) of data on which you wish to perform FFT analysis. This can be done using the Extract layers operator:
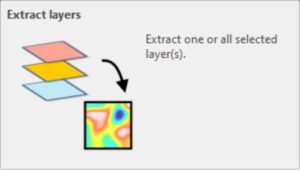
Locating FFT tools in the interface
There are several different operators and studies in Mountains® based on Fourier analysis. These can be found in the “Operators” and “Studies” tabs:
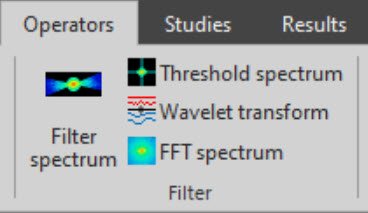
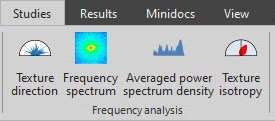
Using the frequency spectrum study
This tool will allow you to generate an interactive representation of the frequency spectrum of your data. It can be useful when analyzing the components of a surface with motifs in order to highlight their periodicity or orientation.
The example below shows a motor cylinder surface with honing marks. The Frequency Spectrum study provides wavelength, angle, phase and magnitude parameters for each point on the surface.
An option for choosing logarithmic or a linear scale is available. Logarithmic scale is useful when your data contains periodic motifs. The tool is fully interactive: move the cursor and the parameters table is automatically updated.
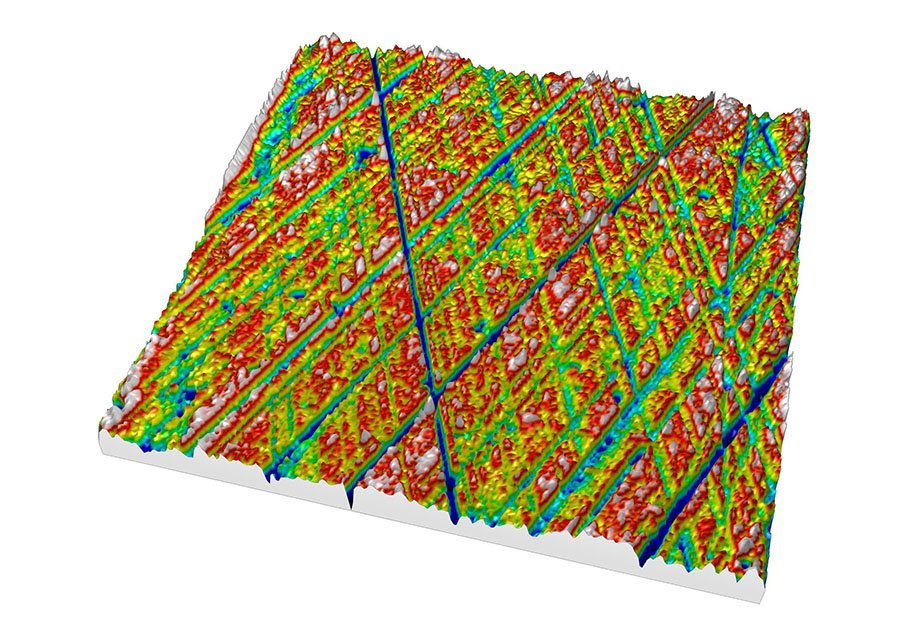 Left. A motor cylinder surface with honing marks.
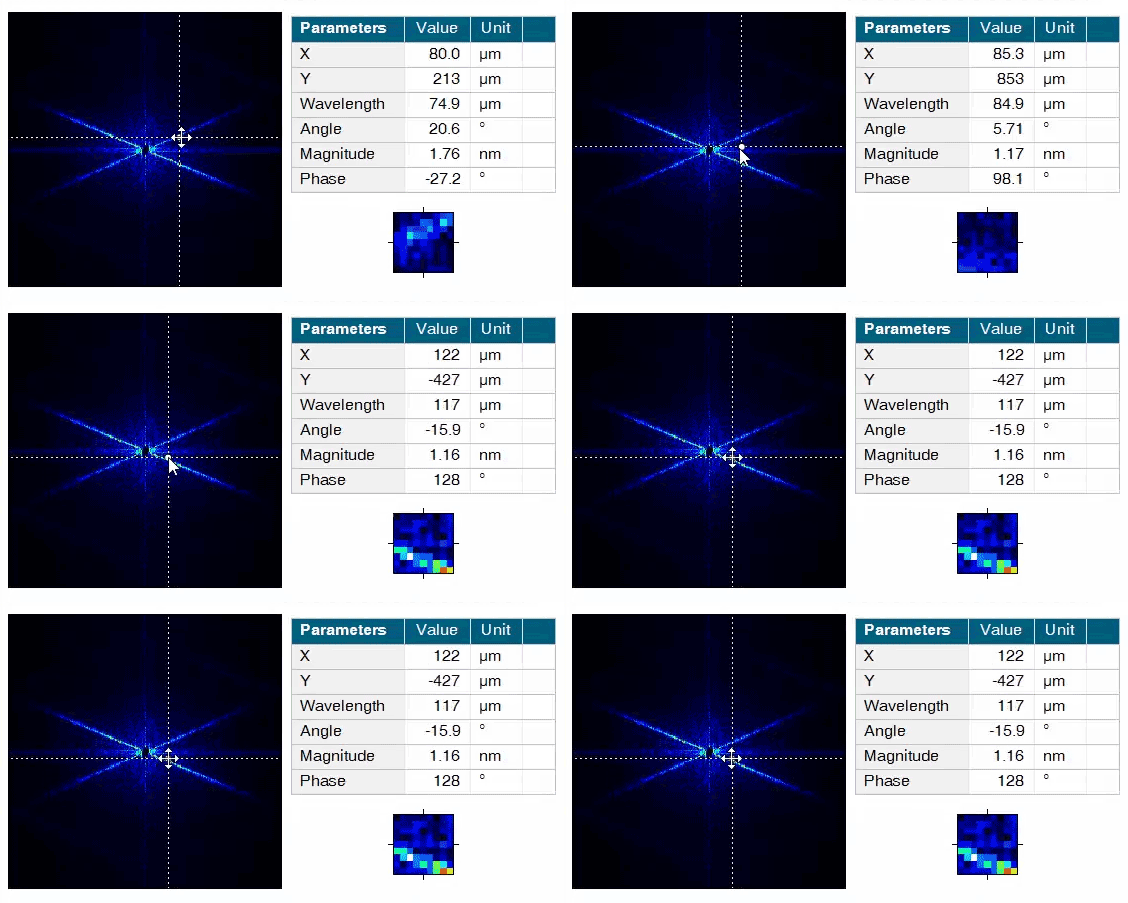
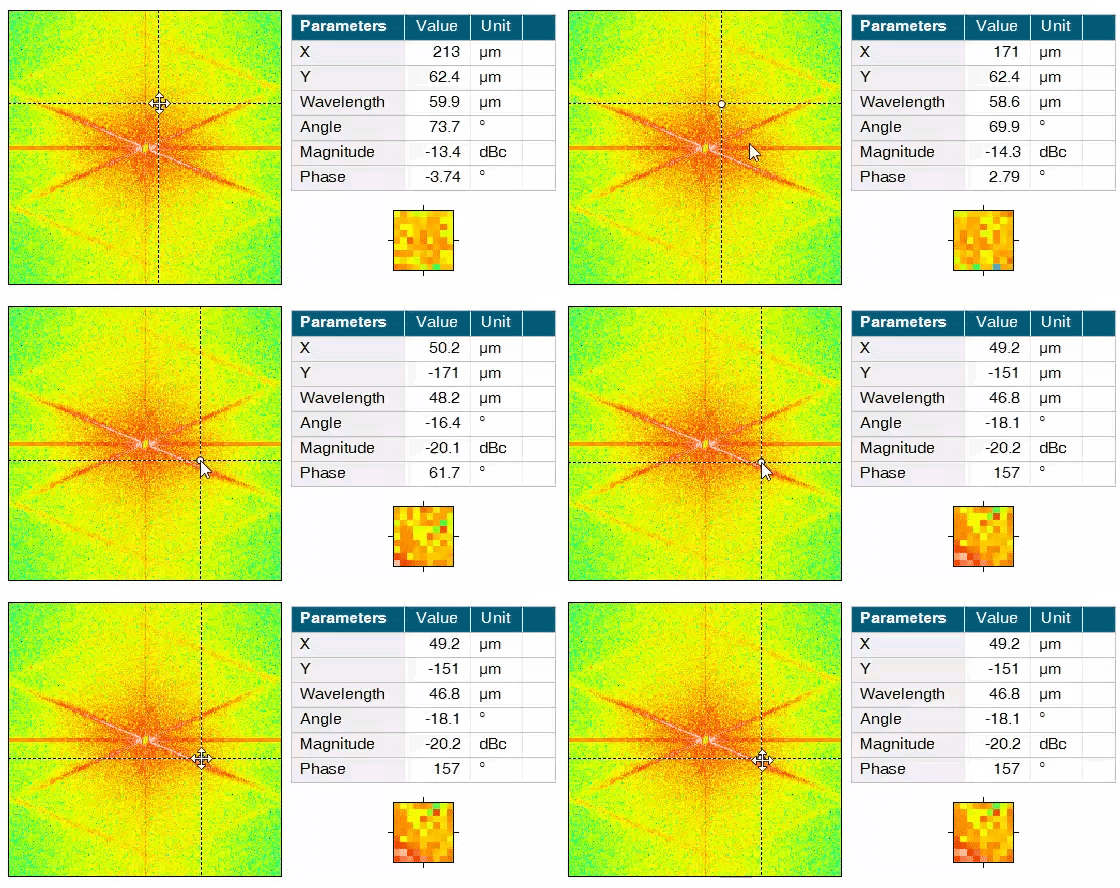
Above. The Frequency Spectrum study provides an interactive plot with a logarithmic or linear scale. It calculates parameters for each point on the surface.
Power spectrum density: see wavelength intensity
The Averaged Power Spectrum Density (PSD) tool helps you gain a more detailed understanding of your data. It is widely used in optics, often to characterize polished surfaces and super-finishing with very little roughness. You can display an interactive plot with wavelength on the X-axis and intensity (square of the amplitude) on the y axis.
The images below show AFM topography of a glass surface before and after an acid attack and their corresponding PSD plots.
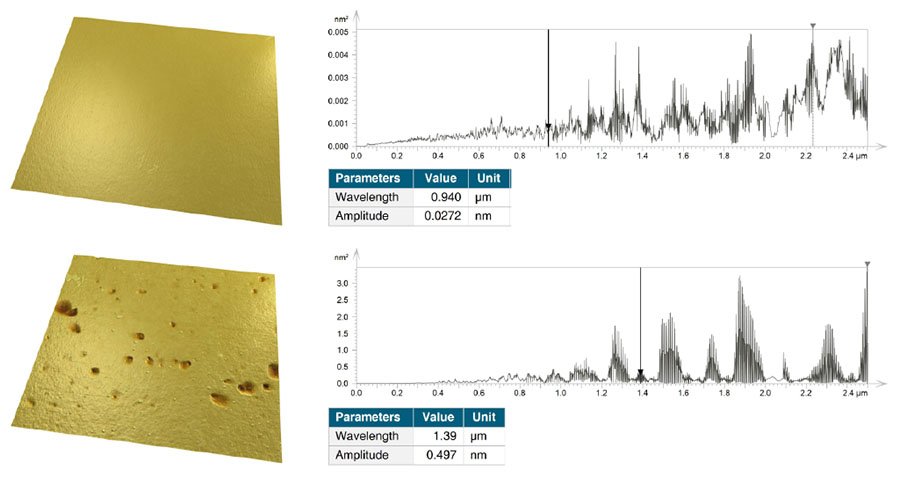
Above. AFM topographies and corresponding Power Spectrum Density plots.
Isotropy, directionality, periodicity and more
Many other FFT-based tools relevant to a wide variety of applications are available in Mountains®. Dominant surface directions can be displayed, texture isotropy can be calculated and auto-correlation tools help distinguish between isotropic surfaces (with a circular central node) and anisotropic surfaces (with a central node extended along one direction).
Read more:
- Reference Guide (Help files): press F1 in Mountains®
- Filtration Techniques for Surface Texture in the Surface Metrology guide