The new Mountains® 10.3 version has just been launched. This update introduces a plethora of new features designed to enhance the platform’s analysis capabilities across various fields, from surface topography to spectral analysis.
Customers with an active maintenance plan can access this update in Mountains® software (open the Help tab and click on Search for updates).
If your maintenance plan is inactive and you wish to update to Mountains® 10.3, contact our team by clicking the button below:
Alternatively, you can get a Free Trial of Mountains 10.3 to check out the new features!
Check out what’s new in this update!
- Cross-technology features
- Profilometry features
- SEM features
- Correlation & spectroscopy features
- SPM features
Cross-technology features
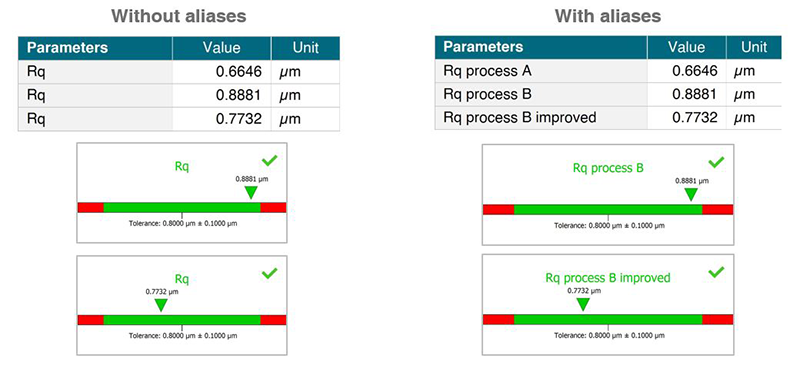
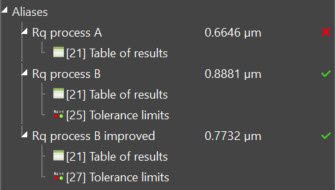
Rename results using aliases
A new, convenient way to tag numeric results and find them again easily
- Attribute a custom name to specific numeric results
- Select several results and create multiple aliases in one step
- Displayed in the Result manager, Table of results and in numeric exports
Particle Analysis: new classification manager
Save classifications for re-use or sharing with other users
- Guarantee reliability of classes by minimizing human error
- Exchange useful/complex classifications with colleagues without having to recreate them from scratch

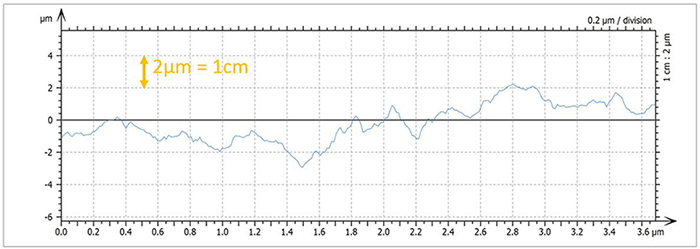
Define graduation settings for profiles
- Set a fixed X- or Z-scale relative to the page to facilitate comparisons between profiles
- Define graduations to meet journal requirements for publications
Apply masks to partition surfaces
- Partition a surface into several regions of interest, even if they have similar height values
- Apply a mask created from the non-measured points of a surface or using the threshold of another surface

Other new features
- New Autoplace preference: choose to position new studies at the end of the document
- Display workflow showing all post-processing steps applied within the Particle Analysis study (e.g. Refine or Split/Merge)
- Display of Results tables has been optimized for large numbers of results (see below)
New features for profilometry
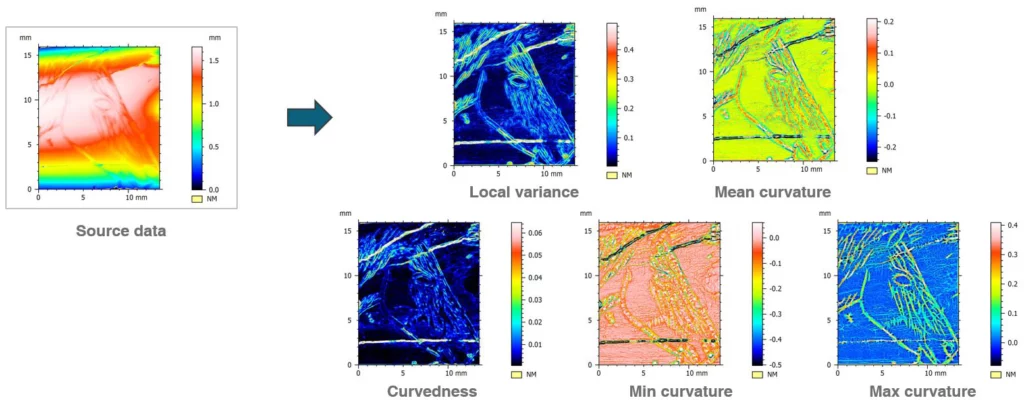
Improved Map local properties operator
- Curvature calculations have been accelerated and operator recall optimized
- New local curvature parameters: surface variance, mean curvature, curvedness, max/min curvature
Compare power spectral densities (PSD)
Improved usability of PSD tool introduced in v10.2
- Compare surfaces and profiles more easily
- Assemble power spectral densities from measurements at different scales for multi-scale analysis
- Display secondary axis in wavelength, use interactive cursors for RMS, set ISO10110-8 specification values etc.
Improved tools for defect removal
- Save time when working with series of profiles or surfaces by applying Remove outliers/asperities tools directly on the series (rather than having to generate each element of the series and process it individually)
- Visualize & remove defects on arc-shaped or sloping profiles with the Remove asperities and Retouch points operators


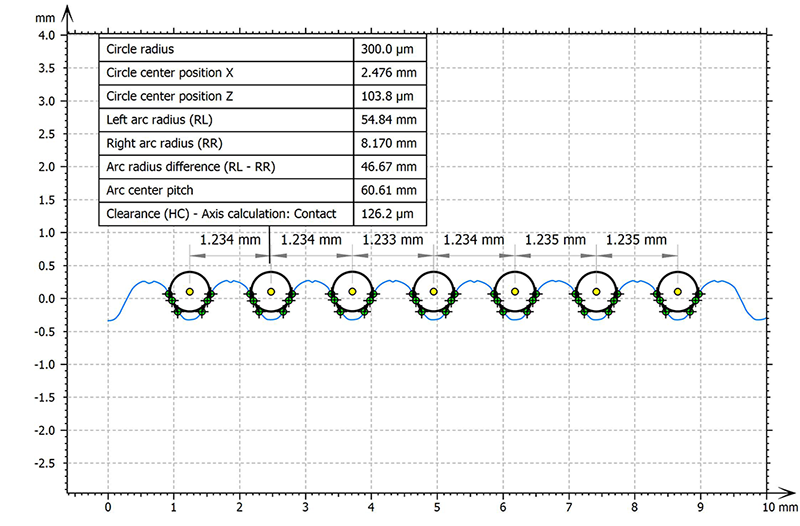
Ball screw analysis (multiple gothic arches)
- Quickly create a large number of gothic arches on a profile in the “Advanced contour” study
- Get valuable insights into how ball screws will function

Other improvements
- In the Scale-sensitive Fractal Analysis (SSFA) study, the assignment of colors to each element in a series allows easy comparison
- Users can now add parameters in add-on operators
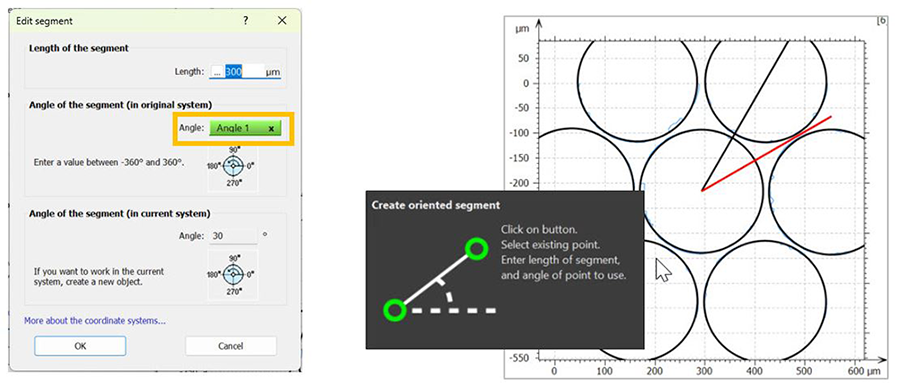
- Contour study: result picker now available in Create oriented segment (see below)
New features for SEM
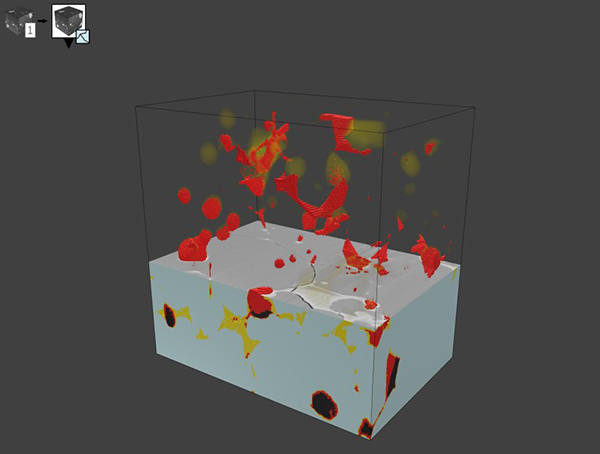
FIB-SEM/EDX cubes: cutting planes in 3D view
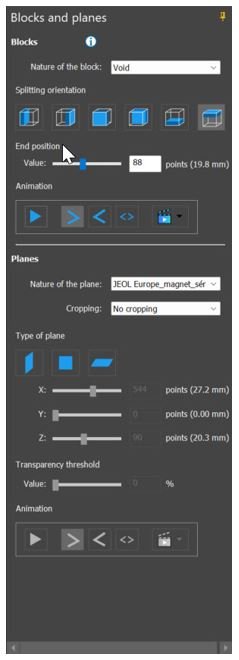
- New ”Blocks and planes” panel for enhanced display and animation of materials in multi-channel cube data
- Select crop options, set transparency threshold, move plane position using slider, display bounding box etc.
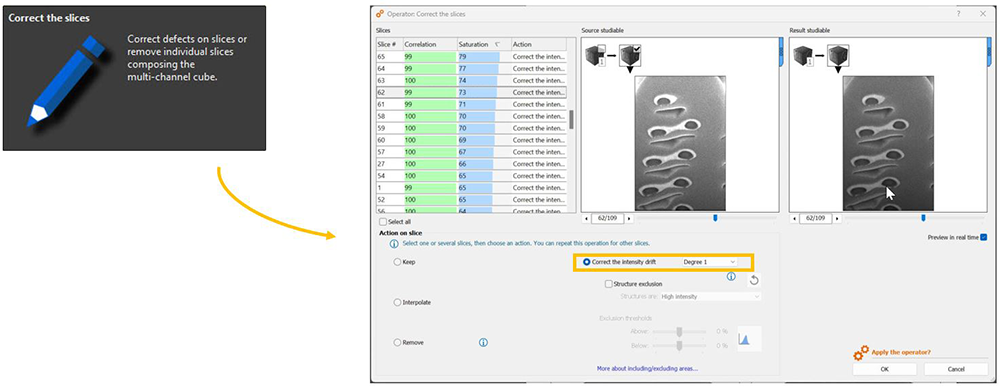
FIB-SEM cubes: correction tools for data slices
- Correct grayscale drift and other anomalies on each cross section, facilitating visualization and segmentation of structures
- New options for correcting slices when loading cube data to limit unnecessary post-processing: shift slices & correct drift
Other improvements
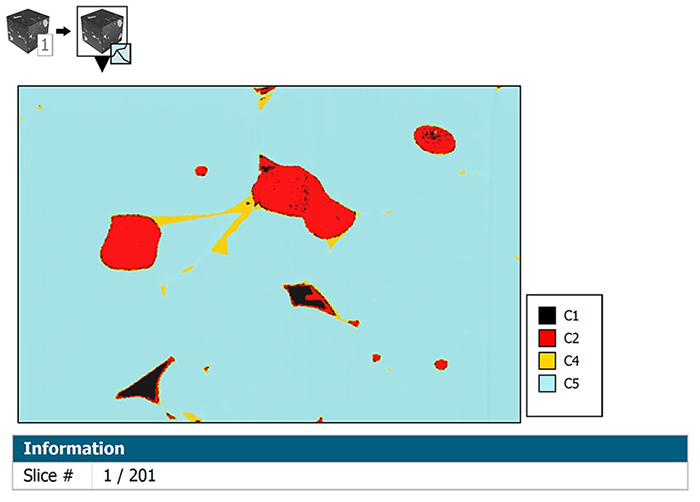
- View segmented data in 2D Pseudo-color view & display legend
- In the “Multi-channel cube analysis” study, results can now be calculated directly on segmented data, if available
- Create cube datasets from series of images
New features for correlation & spectroscopy
New methods for correcting spectra
New features for pre-processing spectral data, in particular for cathodoluminescence and photoluminescence
- New Convert W-axis operator: convert spectral axis and correct intensity
- New option for baseline correction: baseline in the form of a straight line, fitted on selected zones
- Subtract operator improved
- Multiply/Divide operator now works for spectral correction

Improved summary of spectral band analysis
- Visualize interactive colorized spectral bands in the Summary of current operator
- Change band position without having to recall the operator
- Display more information about bands: position, unit etc.
Convert images to spectral maps
- Convert RGB/grayscale images into spectral maps (non-topographic surfaces)
- Opens up new possibilities in data pre-processing and analysis
- Batch conversion and conversion of images with multiple channels is possible

Calculate colocalization coefficients
- In fluorescence microscopy, obtain numerical values expressing overlap (colocalization) of two sets of particles/cells
- Calculate Pearson’s Correlation Coefficient (PCC) and Mander’s Overlap Coefficient (MOC)

New features for SPM
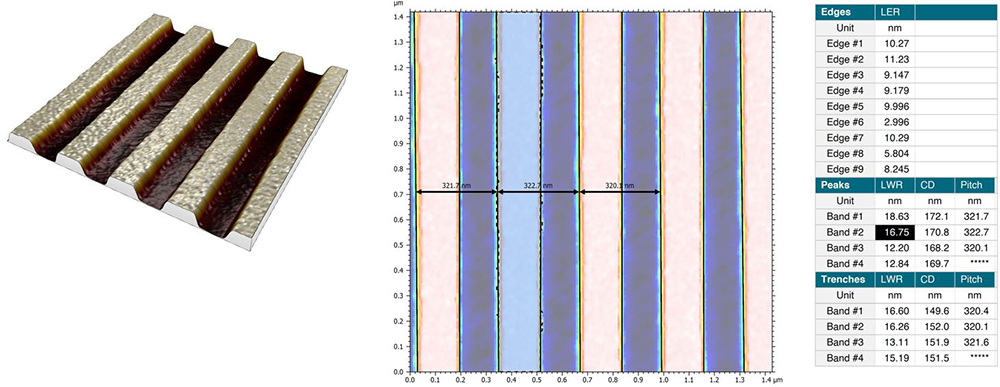
Calculate line edge roughness (LER) on topography
- In semiconductor fabrication processes, quantify roughness of the flanks on grooves
- Calculate LER parameters for each edge line, LWR (line width roughness), pitch, and critical dimensions for each band
Learn more & update
Check the release notes for full details of the v10.3 release.
Access to this latest release is included in the Mountains® Software Maintenance Plan (SMP). Please visit our Software Updates page.
To find out more about SMP options, please contact sales@digitalsurf.com or visit this page.