Past humans manufactured a variety of stone tools for diverse uses. These tools are found in abundance at archeological sites and often represent the only record of the presence and behaviors of these past humans.
Tool use leaves specific microscopic wear patterns on the tool surface. Traditionally, these patterns have been analyzed in 2D and qualitatively, but 3D quantitative analysis is seen as a way to improve the objectivity of the analysis. While many such quantitative analyses have been applied to stone tools made of flint, very few have focused on quartzite tools, even though many important archeological sites yield mostly quartzite artifacts.
3D surface analysis of quartzite flakes
For this study, Dr. Antonella Pedergnana, along with a research team from Germany, Spain and England, knapped quartzite flakes to look like archeological ones. An actualistic experiment was carried out in which different flakes were used to process different materials: bone, antler, wood, cane and hide, with some flakes left unused as a control.
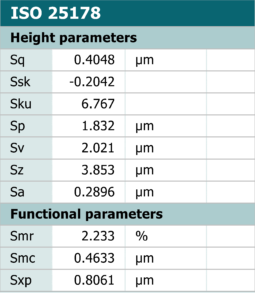
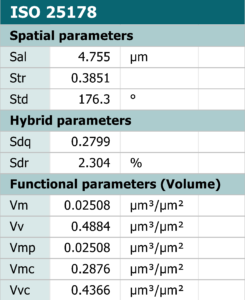
The surfaces of these experimental tools were then scanned in 3D with an LSM800 confocal microscope (Carl Zeiss Microscopy GmbH). The resulting surfaces were processed using Zeiss ConfoMap software (based on MountainsMap®) to calculate a range of surface texture parameters from the ISO 25178 standard, and also to perform scale-sensitive fractal analysis, and motif, furrow and texture direction analyses.
Speeding up the analysis process with templates
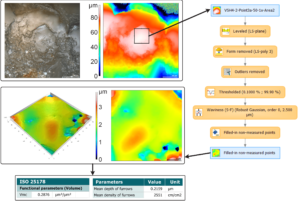
Given the high volume of data that needed to be analyzed, each scan was processed in batch using different templates that were created within the software. These templates applied different operations and filters to each dataset in order to make the calculation of 3D surface texture parameters possible. The use of templates for this study sped up the process significantly.

Above. Template of a processing workflow from the acquired surface. Top left. Bright-field image of studied surface. Top right. Topography of the image. Bottom left. Topography of the surface in 3D. Bottom right. Topography of the surface in 2D. The values for Mean density of furrows, Mean depth of furrows, and Vmc are given for this surface.
Analyzing results
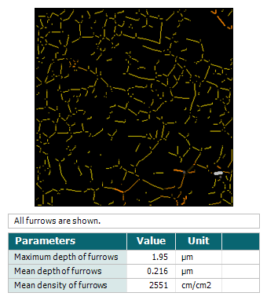
Beside improvements in repeatability and reproducibility, quantitative analysis makes it possible to apply machine-learning algorithms that can classify surface textures into classes of worked material using only the Mean density and Mean depth of furrows parameters, and Vmc.


Above left. ISO 25178 parameters tables. Above right. Furrows analysis.
In doing so, it was shown that wear due to some worked materials (hide and bone) is very specific and easily identifiable, while others (antler and wood) are mixed with each other; the remaining ones (cane, unused) cannot be classified with any certainty.
Conclusion
While several surfaces were analyzed per sample, this preliminary analysis was still applied to a small number of samples; adding more samples will surely improve the accuracy of the classification. This will in turn make the quantitative analysis even more reliable in deciphering how past humans used their tools, in order to better understand their behaviors.
About the authors
Dr. Ivan Calandra and Dr. Antonella Pedergnana are researchers at MONREPOS Archaeological Research Centre and Museum for Human Behavioural Evolution (RGZM). Konstantin Bob is a research associate and PhD candidate in computer science at Johannes Gutenberg University Mainz.


From left to right. Ivan Calandra, Antonella Pedergnana and Konstantin Bob.
References
Pedergnana A, Calandra I, Evans AA, Bob K, Hildebrandt A & Ollé A (2020). Polish is quantitatively different on quartzite flakes used on different worked materials. PLOS ONE 15(12): e0243295. https://doi.org/10.1371/journal.pone.0243295.
Instrument & software used
Zeiss LSM800 confocal microscope + Zeiss ConfoMap based on MountainsMap®.